
RTP measures theoretical return on the amount wagered. Bonus odds measure how often the wheel reaches a fish field. The lower 94.55% Red figure applies to a published maximum-stake case affected by a cash cap.
RTP by bet · Weighted RTP · Cash cap and 94.55% · Bonus odds · Gaps and streaks
Ice Fishing RTP and House Edge by Bet
The published Jokerbet rules list these values without applying the maximum payout limit.
| Betting field | Published RTP before cap effects | House edge | Expected loss per €1,000 turnover |
|---|---|---|---|
| Leaf 1 | 97.10% | 2.90% | €29.00 |
| Leaf 2 | 97.10% | 2.90% | €29.00 |
| Lil’ Blues — Blue Fish | 95.69% | 4.31% | €43.10 |
| Big Oranges — Orange Fish | 95.60% | 4.40% | €44.00 |
| Huge Reds — Red Fish | 95.17% | 4.83% | €48.30 |
Expected-loss amounts are arithmetic illustrations using the listed RTP and no payout truncation. They are not recorded session results.
House edge = 100% − RTP
For the same €1,000 turnover, the uncapped theoretical loss is €19.30 higher on Red than on one Leaf. Red can produce the larger individual multiplier, but its published average return is lower.
The base RTP covers the game’s payout mechanics, including random boosts. Multiplying the ordinary Leaf return by its wheel share alone leaves those boosted returns out; it does not reproduce the published 97.10%.
Turnover, Expected Return and Your Session Balance
For these RTP calculations, turnover is the sum of all accepted stakes in completed wagered rounds. Cancelled-round refunds are excluded together with the refunded stakes. A €100 deposit wagered once gives €100 turnover. If you stake money from earlier credited returns again, those additional bets add to turnover too. A starting balance and the amount wagered over a session can therefore differ considerably.
Use the applicable RTP as a decimal in these calculations:
- Expected credited return = turnover × RTP.
- Expected loss = turnover × (1 − RTP).
If you change betting layouts during a session, apply each layout’s RTP to the turnover wagered with it, then add the expected credits.
At 97.10%, €1,000 turnover gives a theoretical €971 credited return and €29 loss. This includes the money returned through winning rounds; it is not €971 profit on top of the stakes. The actual net result is still total credited returns minus total accepted stakes.
Your next round settles from its actual result, and a short session can finish well above or below the RTP average. Wins, losses and their order determine the balance you see; the theoretical rate gives no fixed refund for a round or session.
For a completed round, the Leaf and fish paytable gives the result’s return factor. Apply it to the accepted winning stake, then subtract the full round cost to find the net gain or loss.
Calculate RTP for Several Bets
Weight each field’s RTP by its share of the total stake. A small Red bet does not carry the same weight as a much larger Leaf bet.
Combined RTP = sum of (stake on each field × that field’s RTP) ÷ TOTAL BET
For €4 on Leaf 1 and €1 on Red, TOTAL BET is €5:
(€4 × 97.10% + €1 × 95.17%) ÷ €5 = 96.714%
Leaf receives four-fifths of the budget and Red one-fifth. Averaging the two percentages equally would describe equal stakes, not this layout. The formula applies to the base values when the named rules apply and payouts are not truncated.
| Accepted betting layout | Round cost | Combined RTP before cap effects | Expected loss per €1,000 turnover |
|---|---|---|---|
| €1 on each Leaf | €2 | 97.10% | €29.00 |
| €1 on each fish — All Bonuses | €3 | 95.4867% | €45.13 |
| €1 on each of all five fields | €5 | 96.132% | €38.68 |
| €4 Leaf 1 + €1 Red | €5 | 96.714% | €32.86 |
Expected losses are compared over €1,000 of turnover, even though the round costs differ. Compare layouts at a fixed round budget when deciding how to divide a particular amount.
Doubling every stake preserves the proportions and leaves this uncapped combined RTP unchanged. It doubles the expected loss per round because twice as much money is wagered. Changing only one field’s stake changes the weights instead.
All Bonuses and All Five Fields
All Bonuses places the chosen chip amount on each of Blue, Orange and Red. With equal accepted stakes, each fish receives one-third of the total budget:
(95.69% + 95.60% + 95.17%) ÷ 3 = 95.4867%, or about 95.49%.
At €1 per fish, the round costs €3 and its theoretical average credit is €2.8646, leaving an expected loss of €0.1354 per round. That average includes the Leaf rounds in which all three fish stakes lose. It is not the amount awarded by every bonus catch. The All Bonuses betting instructions explain the three placements.
Equal stakes on all five fields allocate one-fifth to each bet:
(97.10% + 97.10% + 95.69% + 95.60% + 95.17%) ÷ 5 = 96.132%.
At €1 on every field, the €5 round has a theoretical average credit of €4.8066 and expected loss of €0.1934. Including both Leaves raises the combined RTP above the equal-fish layout, while the larger cost raises the expected loss per round. The two percentages do not compare equal spending per round.
The stakes share one wheel outcome. They do not need to be independent for this weighted expectation calculation: only the corresponding winning field pays, and the expected credits from the separate stakes add. For cap-affected stakes, each RTP input must reflect the applicable stake and rules.
Cash Caps and the 94.55% Red RTP
The Jokerbet EUR rules give these lower fish RTP values at maximum stake, where a payout cap cuts off part of the largest returns. Use them for that published stake condition; they do not apply automatically to smaller bets.
| Fish bet | RTP before cap effects | Published maximum-stake capped RTP | Reduction in percentage points | House edge in the capped reference |
|---|---|---|---|---|
| Blue | 95.69% | 95.15% | 0.54 | 4.85% |
| Orange | 95.60% | 95.00% | 0.60 | 5.00% |
| Red | 95.17% | 94.55% | 0.62 | 5.45% |
At the published Red reference, €1,000 turnover corresponds to €54.50 expected loss, compared with €48.30 before cap effects. The difference is €6.20 per €1,000 turnover. That comparison uses the two published RTP values; it does not determine the RTP for any intermediate stake.
In the SNAI EUR configuration used for the monetary examples, the cap is €500,000 for total winnings in one round. A €100 Red stake at 5,000× reaches that amount exactly and has no payout reduction. A €200 Red stake at the same result calculates €1,000,000 before the cap but credits €500,000 under that rule.
The payout ceases to scale proportionally on those capped outcomes. At Red stakes above €100, the largest possible result can be affected; the exact RTP at, for example, €200 would require the outcome probabilities. The published 94.55% is a maximum-stake reference, not an automatic value for every stake above €100. Cash-cap thresholds and credited amounts show the money calculation.
Explanation diagram Scroll to explore
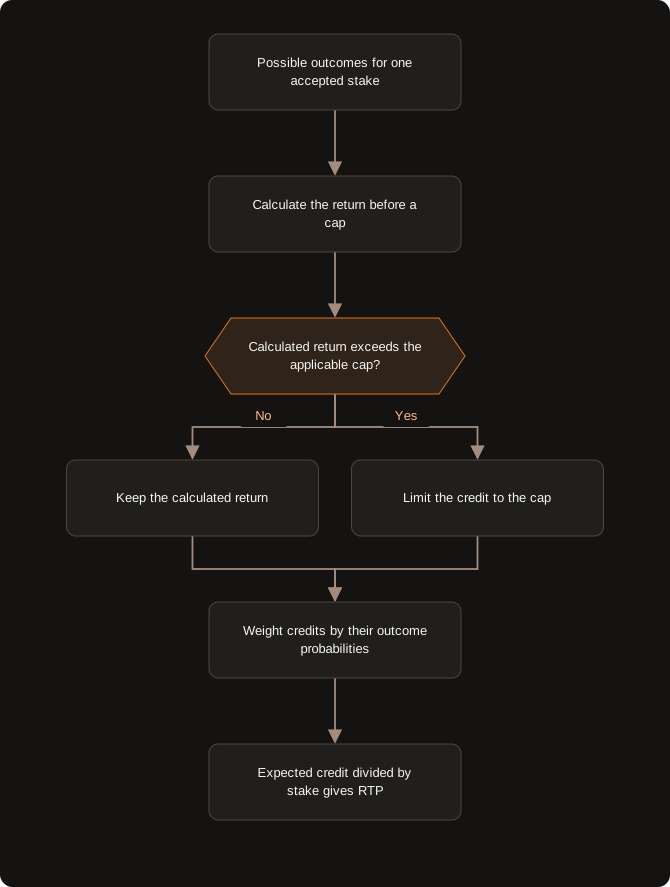
The cap changes credited amounts under the same assumed outcome probabilities. Calculating an exact RTP curve by stake requires those probabilities.
Why Is Ice Fishing Sometimes Listed at 94.55–97.10%?
The endpoints refer to different bets and conditions: 97.10% for Leaf, and 94.55% for Red at the published maximum-stake capped reference. The range is not one return percentage that applies equally to all five fields.
The three capped fish figures average 94.90%. That would be the RTP of equal-stake All Bonuses only if all three figures applied at the same stake amount. The published rules do not confirm a common amount for those references. For equal stakes before cap effects, use 95.4867%; do not replace it with 94.90% for an arbitrary bet.
Ice Fishing Wheel Odds and Bonus Probability
The wheel has 53 segments: 23 Leaf 1, 23 Leaf 2, four Blue, two Orange and one Red. The odds below are derived under an equal-probability segment model. They are not a measured frequency from recent rounds.

Probability of a field = its segment count ÷ 53
| Wheel result or covered group | Segments | Probability in the uniform model |
|---|---|---|
| Leaf 1 | 23 | 43.40% |
| Leaf 2 | 23 | 43.40% |
| Blue — Lil’ Blues | 4 | 7.55% |
| Orange — Big Oranges | 2 | 3.77% |
| Red — Huge Reds | 1 | 1.89% |
| Either Leaf | 46 | 86.79% |
| Any fish bonus | 7 | 13.21% |
All Bonuses covers the seven fish segments when all three placements are accepted. The 13.21% describes a fish trigger, including outcomes that only return the round cost. Under the SNAI settlement rule used for these examples, an unboosted Blue 3× on €1 per fish credits €3 against the €3 round cost: break even. No extra winning stake is added to the fish credit. All Bonuses does not add a sixth wheel result.
Covering both Leaves gives a matching field on 46 of 53 segments in this model. An ordinary Leaf win with €1 on each Leaf merely returns the €2 cost. Covering all five fields gives a matching stake for every wheel result, but an ordinary Leaf credits €2 against a €5 cost when each field has €1. That round is −€3 net. The multiple-bet payout examples separate coverage from profit.
RTP and the Average Return When a Fish Hits
The trigger share can be combined with the uncapped RTP to derive an average credited return conditional on that fish winning, within the same uniform model:
Mean credited return on a hit, per unit winning stake = RTP as a decimal ÷ trigger probability
| Fish bet | Derived average credited return on a hit |
|---|---|
| Blue | 12.68× its winning stake |
| Orange | 25.33× its winning stake |
| Red | 50.44× its winning stake |
For Red, 0.9517 ÷ (1/53) = 50.4401×. The mean combines the different possible Red returns, including boosted outcomes. It is not a base-fish average, the payout of the next catch, or a new paytable factor.
Red’s larger conditional average is paired with a much smaller trigger share. Blue hits more often in this model and has a higher uncapped RTP, despite its lower maximum multiplier. The fish ranges and boost mechanics describe individual catch values.
A Red Trigger Is Not the Chance of 5,000×
The model gives 1/53 for Red landing on the wheel. To reach 5,000×, that round must also produce a 500× base catch with a 10× boost. Counting Red segments does not tell you how often that combination occurs.
P(5,000× Red) = P(Red trigger) × P(5,000× final given a Red trigger)
The formula uses a conditional probability. It does not assume that the catch and boost are independent. Without the joint fish-and-boost distribution, an exact chance of 5,000× cannot be calculated from the published RTP and ranges alone.
Explanation diagram Scroll to explore
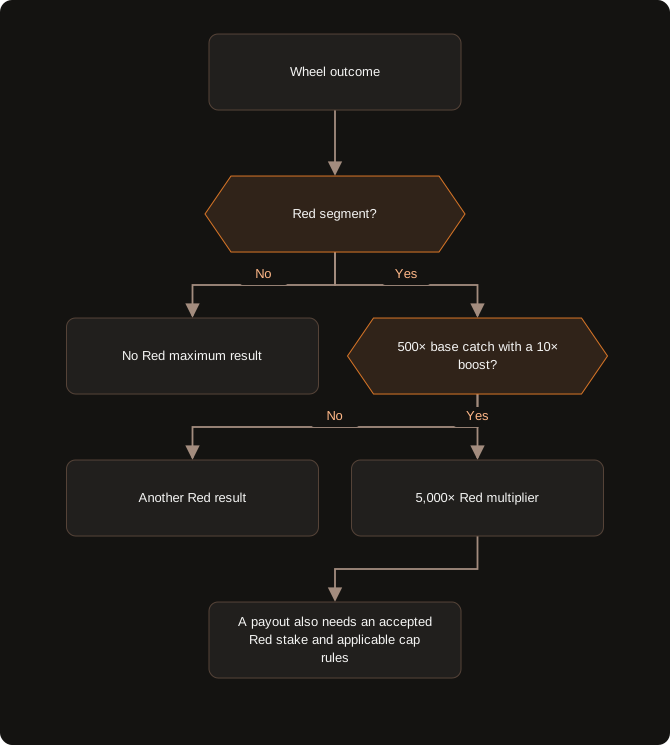
The 1/53 model applies to the first trigger step. No probability is assigned to the maximum catch-and-boost combination here.
Average Waiting Times and Long Bonus Gaps
For independent rounds with the uniform wheel probabilities above, the mean number of rounds until the next hit is 1/p, including the round that produces it.
| Fish result sought | Model probability per round | Mean rounds until the next hit, including that hit |
|---|---|---|
| Blue | 4/53 | 13.25 |
| Orange | 2/53 | 26.50 |
| Red | 1/53 | 53.00 |
| Any fish bonus | 7/53 | 7.57 |
The Red mean of 53 rounds does not set a deadline. It includes the eventual Red round; the expected number of preceding non-Red rounds is 52. For any fish bonus, the corresponding figures are about 7.57 rounds including the hit and 6.57 misses before it.
For a fixed block of N independent future rounds:
- P(no hit in N rounds) = (1 − p)ᴺ
- P(at least one hit in N rounds) = 1 − (1 − p)ᴺ
| Fixed block of rounds | Probability of no fish bonus | Probability of no Red |
|---|---|---|
| 10 | 24.26% | 82.66% |
| 25 | 2.90% | 62.11% |
| 50 | 0.08% | 38.58% |
| 100 | <0.01% | 14.88% |
For 50 rounds, P(no Red) = (52/53)⁵⁰ ≈ 38.58%. Its complement gives about 61.42% for at least one Red in that block. At 53 rounds—the mean waiting time—the no-Red probability is still about 36.44%.
After 50 non-Red rounds, the next-round Red probability remains 1/53 in this independent model. The previous gap does not make Red due. A drought counter describes elapsed rounds; it does not increase the next round’s probability or identify an entry point.
RTP, Volatility and Recent Results
RTP describes the mean return. Volatility concerns how returns are spread across outcomes. The known trigger shares and payout ranges explain why fish stakes can produce long gaps and occasional larger credits, but they do not supply a numerical volatility rating or a complete probability of net profit for every layout.
Even two layouts with the same RTP can settle differently. One Leaf and both Leaves each have 97.10% uncapped RTP. With €1 on each Leaf, an ordinary matching Leaf returns the combined €2 cost; the same ordinary hit on a single €1 Leaf leaves +€1. Bet layouts at the same budget give a fuller comparison of spending and outcomes.
A recent sequence of wheel results can show observed field frequencies for the recorded sample. To calculate a player’s realised return, you also need that player’s accepted stakes and credited amounts for those completed wagered rounds: total credits ÷ total turnover. A short run of bonus symbols is not enough to measure that account’s return or replace the theoretical RTP.
The archived round snapshot and its statistics show Scoreo’s counts for the dated 24-hour sample, including its total number of rounds.
Boosts, when assigned, are revealed after betting closes. A new stake cannot be added after seeing that assignment. The betting window and boost order explain when bets can be accepted.
See round payout and net-result examples · Practise reading a round · Go to the Ice Fishing game page
18+ · Responsible gambling